Whole-body dynamics
Cells throughout the body exhibited a range of calcium dynamics, showcasing diverse temporal spectra, including oscillatory, pulsatile, and bistable activity. These calcium dynamics are referred to as cellular 'activity'. The presence of signal fluctuations was observed in the majority of cells, indicating that the dynamic range of the GCaMP7f sensor is sufficiently broad to capture calcium dynamics across cells of different organs. Collectively, these findings demonstrate how the ubiquitous expression of molecular sensors, in conjunction with spinning-disk confocal microscopy, allows for extensive access to and identification of cellular dynamics throughout the body, thereby facilitating the study of their interactions.
Population-level cellular dynamics
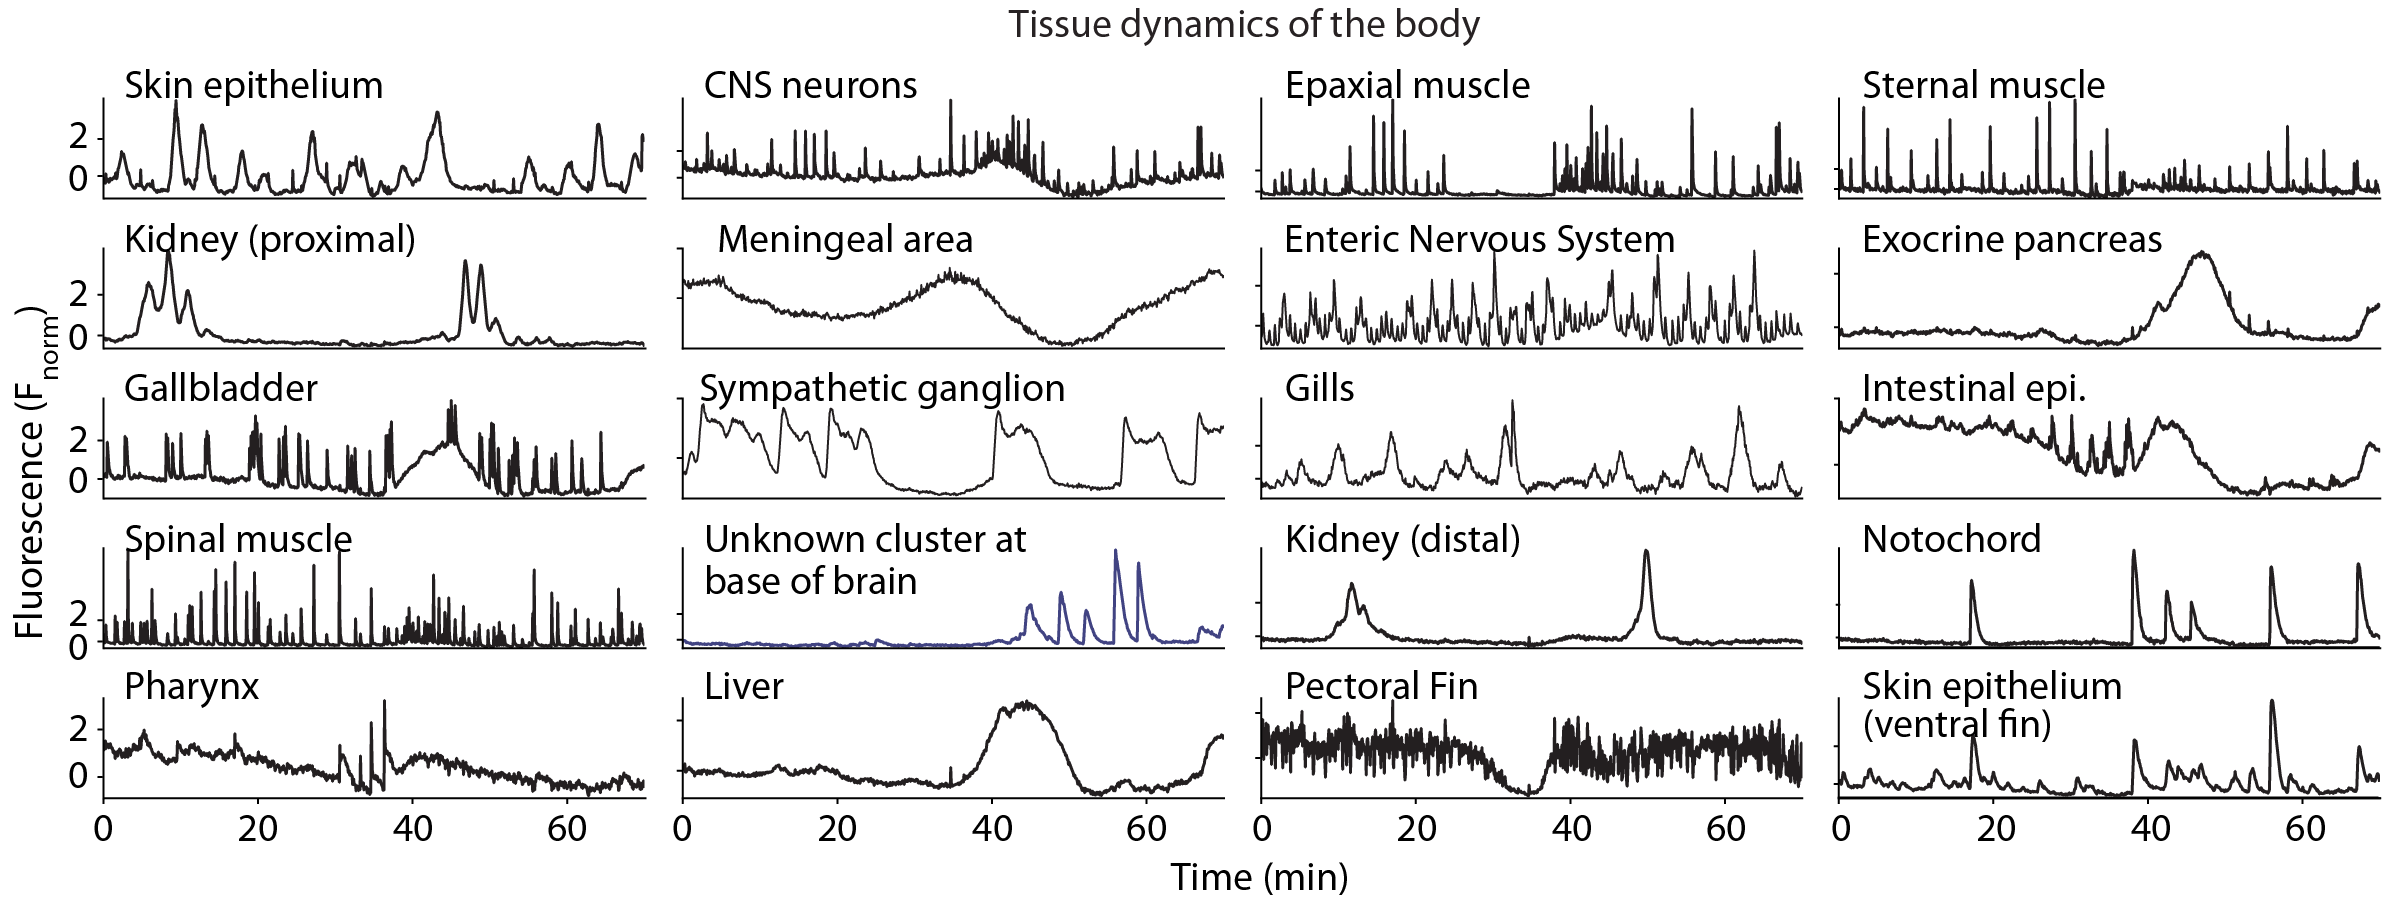
Examples of distinct dynamic profiles present across functional tissue compartments: high-frequency dynamics (e.g.: neurons and muscles), slower evolving activity (e.g.: nephric tissue), tonic bi-stable dynamics (e.g.: sympathetic ganglion) as well as oscillatory activity (e.g.: enteric tissue). Functional clusters were derived from Spectral Clustering.
WBI discovers within-organ cellular population dynamics.
As an example, the workflow described above parcellates the kidney nephron into contiguous functional tissue compartments, each exhibiting distinct dynamics, which together couple into traveling waves that occur in bursts. The spatial propagation, coupled with the observed quiescence between bursts, implies that kidney filtration — mostly measured at low temporal resolution[@teixido-trujillo_measured_2023] and conceptualized as a continuous or continuously oscillating process1 — may in fact be intermittent and pulsatile on shorter timescales.
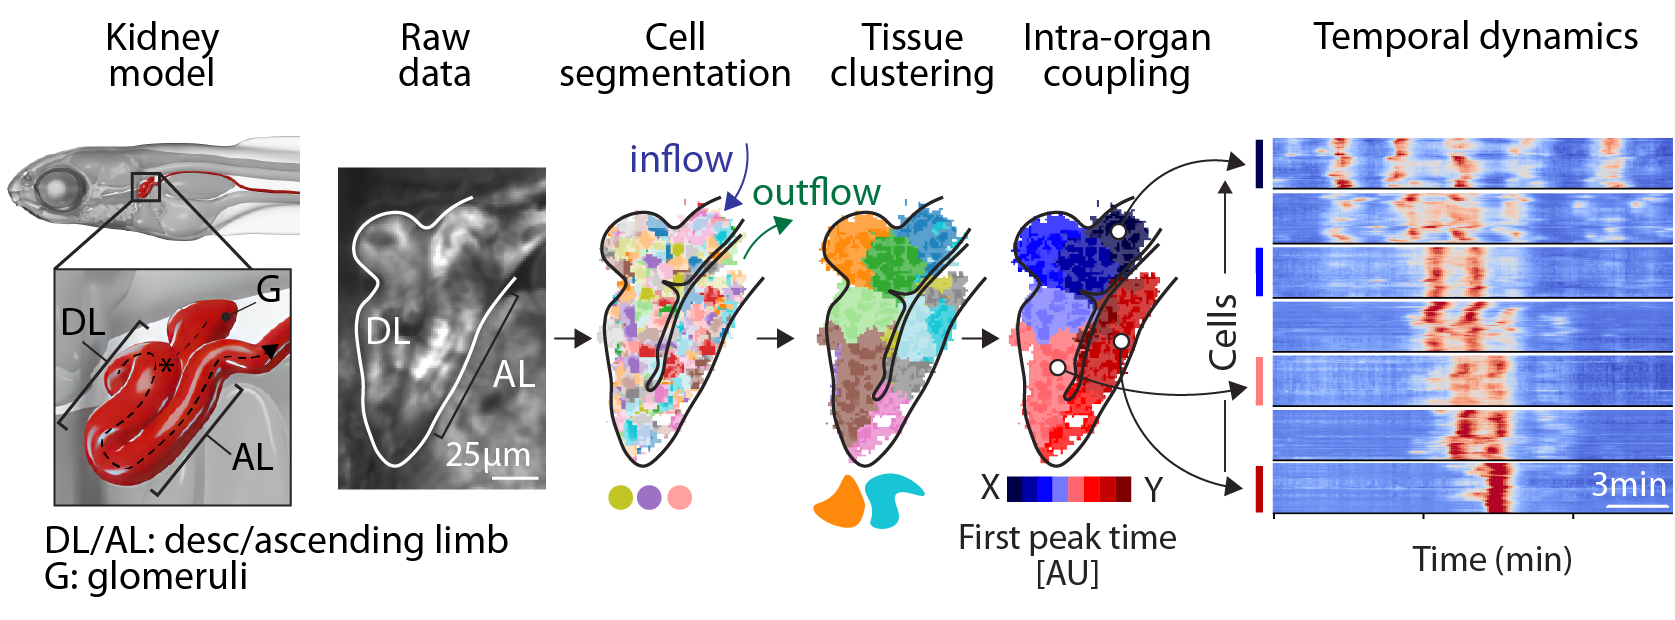
Example of functional compartments identified within the kidney nephron. ExM reconstruction of young zebrafish kidney. A central glomerulus gives rise to two bilateral nephrons, each consisting of a U-shape tube through which filtrate passes, which then course caudally merging at the cloaca. _Left to right_: 1) raw functional data, 2) cellular segmentation, 3) nephric functional compartments, 4) nephron clusters ordered by time to first activity peak within a burst and 4) raster of cellular activity within a single nephric burst, grouped by functional compartment and ordered using Rastermap.